Offsprings resulting from a toxicity test
C.dubia.RdResults from a chronic reproduction toxicity test with seven different concentrations of waste water. The response was the number of offspring produced by the water flea Ceriodaphnia dubia.
Usage
data(C.dubia)Format
A data frame with 50 observations of the following 2 variables.
conca numeric vector giving waste water in percentage
numbera numeric vector
Source
A. J. Bailer and J. T. Oris (1997). Estimating inhibition concentrations for different response scales using generalized linear models. Environmental Toxicology and Chemistry, 16:1554–1559.
Examples
library(drc)
## Displaying the data
head(C.dubia)
#> conc number
#> 1 0 27
#> 2 0 30
#> 3 0 29
#> 4 0 31
#> 5 0 16
#> 6 0 15
## Fitting a three-parameter log-logistic model
C.dubia.m1 <- drm(number ~ conc, data = C.dubia, fct = LL.3())
summary(C.dubia.m1)
#>
#> Model fitted: Log-logistic (ED50 as parameter) with lower limit at 0 (3 parms)
#>
#> Parameter estimates:
#>
#> Estimate Std. Error t-value p-value
#> b:(Intercept) 16.1372 61.8281 0.2610 0.7952
#> d:(Intercept) 28.7500 1.1123 25.8464 < 2.2e-16 ***
#> e:(Intercept) 11.9536 2.0608 5.8004 5.39e-07 ***
#> ---
#> Signif. codes: 0 '***' 0.001 '**' 0.01 '*' 0.05 '.' 0.1 ' ' 1
#>
#> Residual standard error:
#>
#> 7.03479 (47 degrees of freedom)
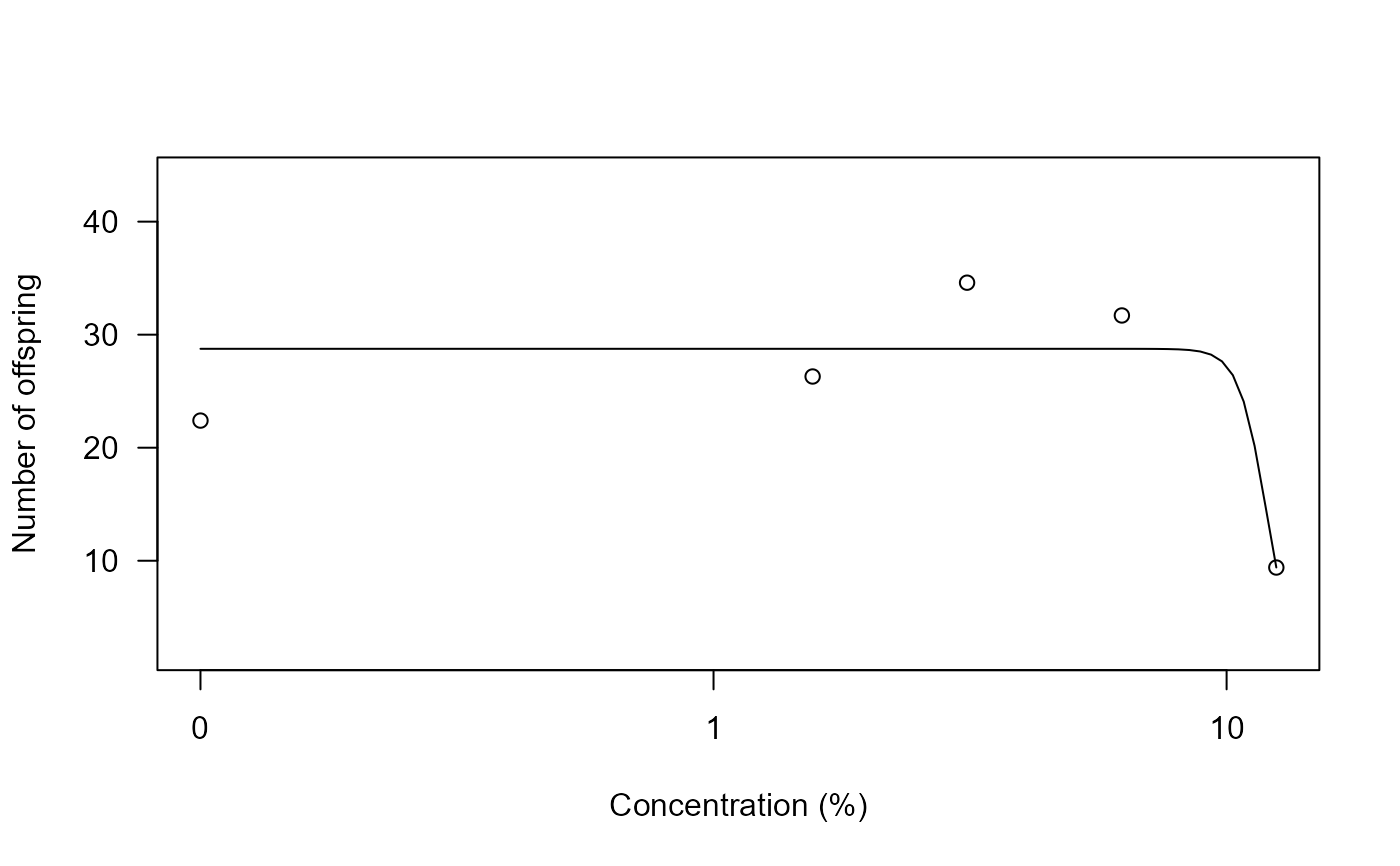
## Plotting fitted curve together with the original data
plot(C.dubia.m1, xlab = "Concentration (%)", ylab = "Number of offspring")