Cadmium Daphnia Data
CadmiumDaphnia.RdData from an acute toxicity test exposing Daphnia to cadmium over time. The endpoint measured was mortality (number of dead organisms) at each dose and time point.
Usage
data(CadmiumDaphnia)Format
A data frame with 58 observations on the following 6 variables.
Dosea numeric vector of dose values
Timea numeric vector
Totala numeric vector
Starta numeric vector
Enda numeric vector
Deada numeric vector
Examples
library(drc)
## Displaying the data
head(CadmiumDaphnia)
#> Dose Time Total Start End Dead
#> 1 0.0 2 50 0 2 0
#> 2 0.0 4 50 2 4 0
#> 3 0.0 7 50 4 7 0
#> 4 0.0 9 50 7 9 0
#> 5 0.0 11 50 9 11 0
#> 6 0.0 14 50 11 14 0
## Fitting a two-parameter log-logistic model for binomial response at a single time point
CadmiumDaphnia.sub <- CadmiumDaphnia[CadmiumDaphnia$Time == 7, ]
CadmiumDaphnia.m1 <- drm(Dead/Total ~ as.numeric(as.character(Dose)), weights = Total,
data = CadmiumDaphnia.sub, fct = LL.2(), type = "binomial")
summary(CadmiumDaphnia.m1)
#>
#> Model fitted: Log-logistic (ED50 as parameter) with lower limit at 0 and upper limit at 1 (2 parms)
#>
#> Parameter estimates:
#>
#> Estimate Std. Error t-value p-value
#> b:(Intercept) -1.00362 0.21675 -4.6303 3.651e-06 ***
#> e:(Intercept) 132.42840 51.34644 2.5791 0.009905 **
#> ---
#> Signif. codes: 0 '***' 0.001 '**' 0.01 '*' 0.05 '.' 0.1 ' ' 1
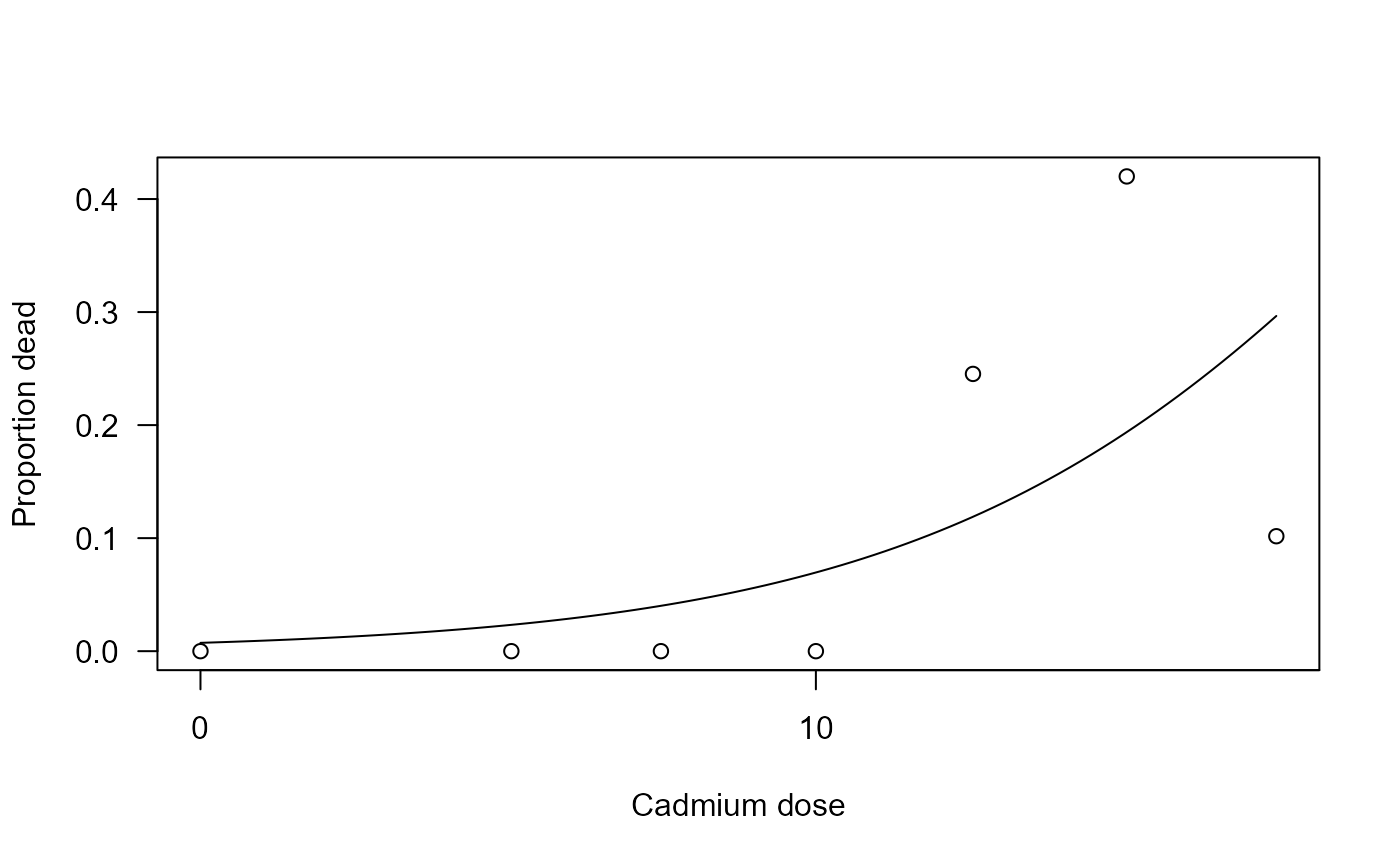
## Plotting the fitted curve
plot(CadmiumDaphnia.m1, xlab = "Cadmium dose", ylab = "Proportion dead")