The NEC model is a dose-response model with a threshold below which the response is assumed constant and equal to the control response. It has been proposed as an alternative to both the classical NOEC and the regression-based EC/ED approach.
Arguments
- fixed
numeric vector specifying which parameters are fixed and at what value they are fixed. NAs are used for parameters that are not fixed.
- names
a vector of character strings giving the names of the parameters (should not contain ":"). The default is reasonable (see under 'Usage').
- fctName
optional character string used internally by convenience functions.
- fctText
optional character string used internally by convenience functions.
Details
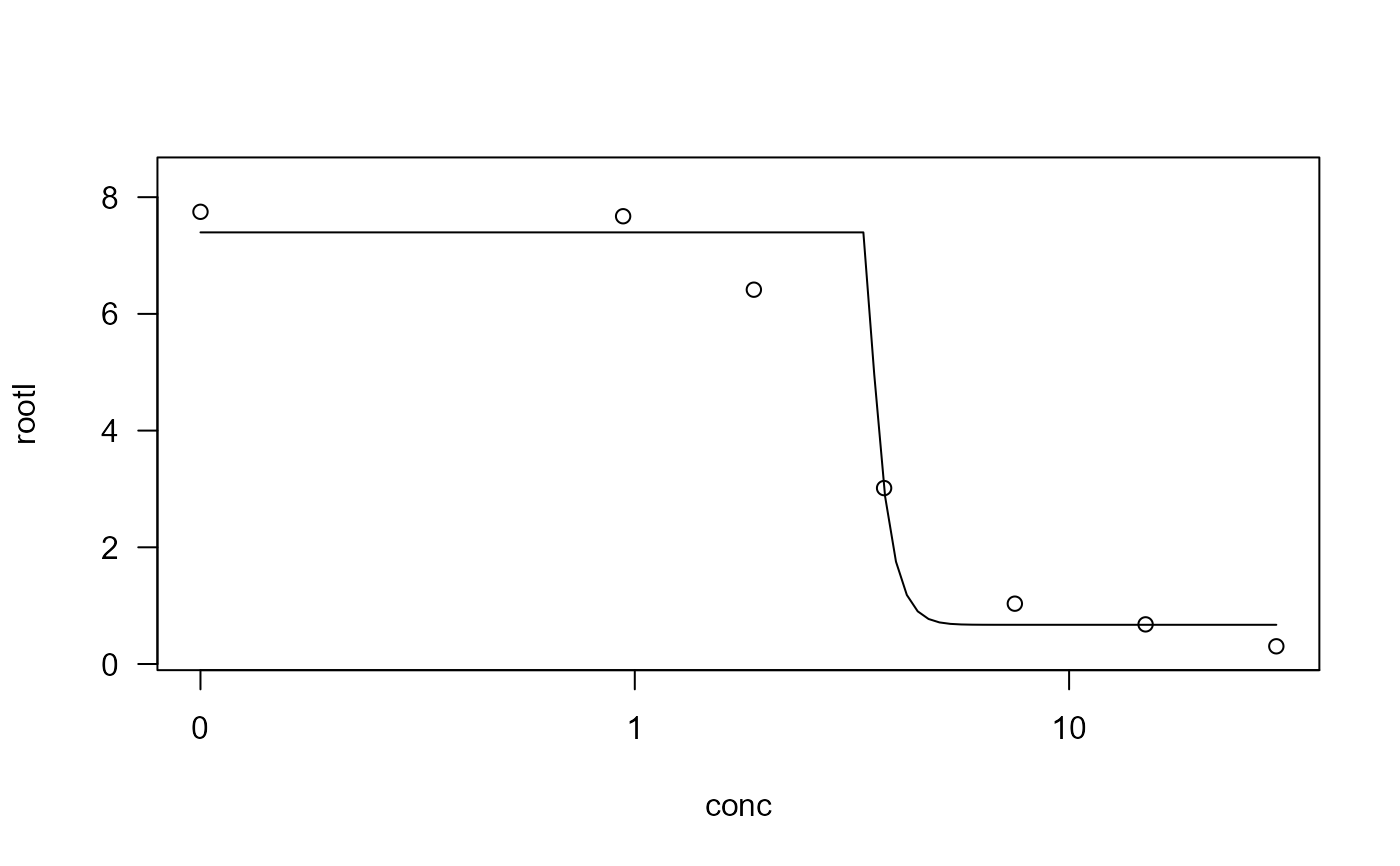
The NEC model function proposed by Pires et al (2002) is: $$f(x) = c + (d-c)\exp(-b(x-e)I(x-e))$$ where \(I(x-e)\) is the indicator function equal to 0 for \(x<=e\) and 1 for \(x>e\).
References
Pires, A. M., Branco, J. A., Picado, A., Mendonca, E. (2002) Models for the estimation of a 'no effect concentration', Environmetrics, 13, 15–27.
Examples
nec.m1 <- drm(rootl ~ conc, data = ryegrass, fct = NEC.4())
summary(nec.m1)
#>
#> Model fitted: NEC (4 parms)
#>
#> Parameter estimates:
#>
#>                Estimate Std. Error t-value   p-value
#> b:(Intercept)   3.16938  393.27265  0.0081  0.993650
#> c:(Intercept)   0.67201    0.23463  2.8641  0.009592 **
#> d:(Intercept)   7.39666    0.20260 36.5091 < 2.2e-16 ***
#> e:(Intercept)   3.41729   41.27705  0.0828  0.934842
#> ---
#> Signif. codes:  0 '***' 0.001 '**' 0.01 '*' 0.05 '.' 0.1 ' ' 1
#>
#> Residual standard error:
#>
#>  0.7017905 (20 degrees of freedom)
plot(nec.m1)