Competition between two biotypes
RScompetition.RdTo assess the competitive ability between two biotypes of Lolium rigidum, one resistant to glyphosate and the other a sensitive wild type, the density of resistant and sensitive biotypes was counted after germination.
Usage
data(RScompetition)Format
A data frame with 49 observations on the following 3 variables.
za numeric vector with densities of the resistant biotype (plants/m2)
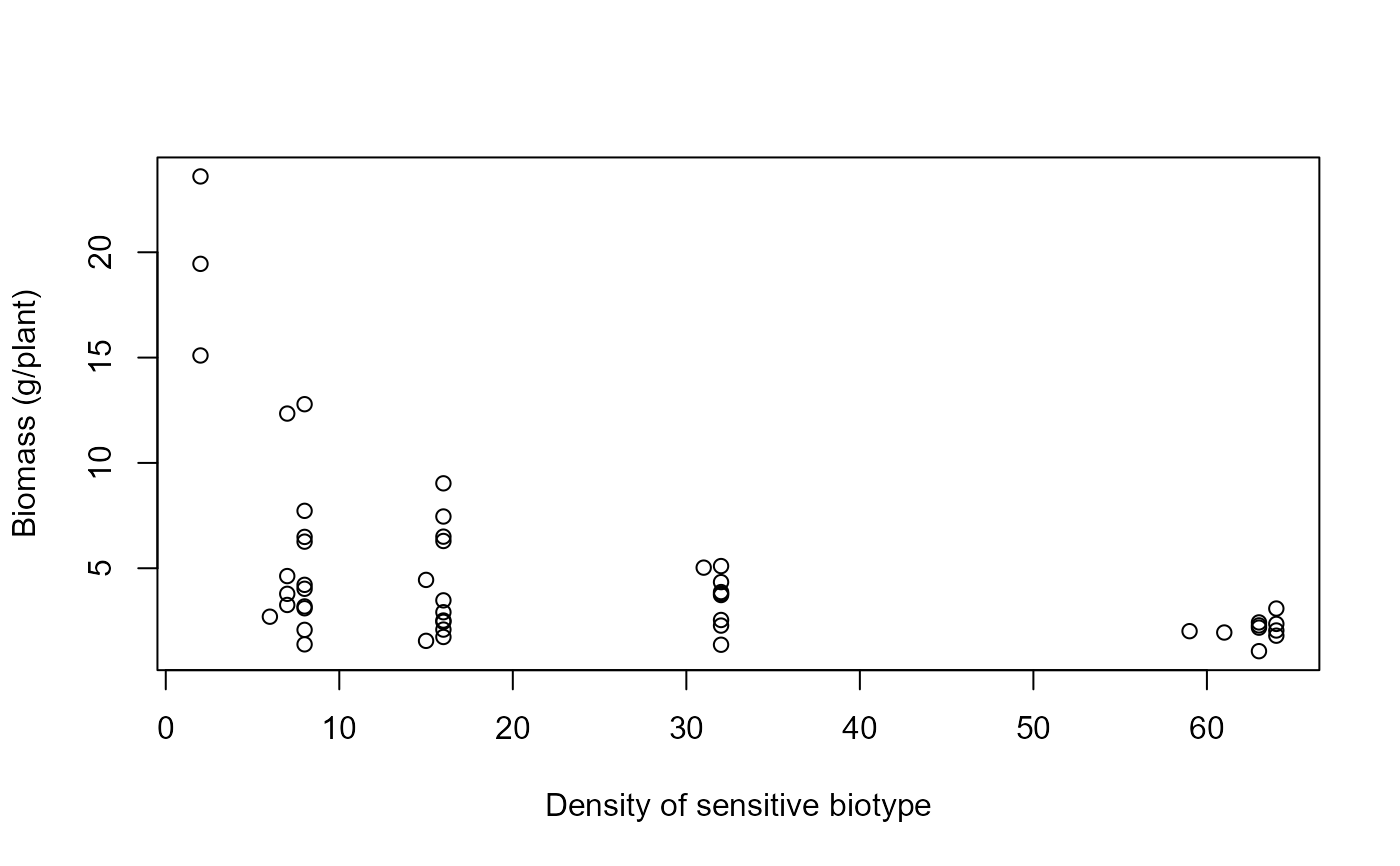
xa numeric vector with densities of the sensitive biotype (plants/m2)
biomassa numeric vector of biomass weight (g/plant)
References
Jensen, J. E. (1993) Fitness of herbicide-resistant weed biotypes described by competition models, Proceedings of the 8th EWRS Symposium, 14-16 June, Braunschweig, Germany, 1, 25–32.
Pedersen, B. P. and Neve, P. and Andreasen, C. and Powles, S. (2007) Ecological fitness of a glyphosate resistant Lolium rigidum population: Growth and seed production along a competition gradient, Basic and Applied Ecology, 8, 258–268.
Examples
library(drc)

## Displaying the data
head(RScompetition)
#>    z  x biomass
#> 1  8  8 7.72500
#> 2  8 16 3.47500
#> 3  7 32 3.86875
#> 4  8 61 1.94918
#> 5 16  8 3.10000
#> 6 16 16 2.91250

## Plotting biomass as a function of sensitive biotype density
plot(biomass ~ x, data = RScompetition, xlab = "Density of sensitive biotype",
ylab = "Biomass (g/plant)")