Potency of two herbicides
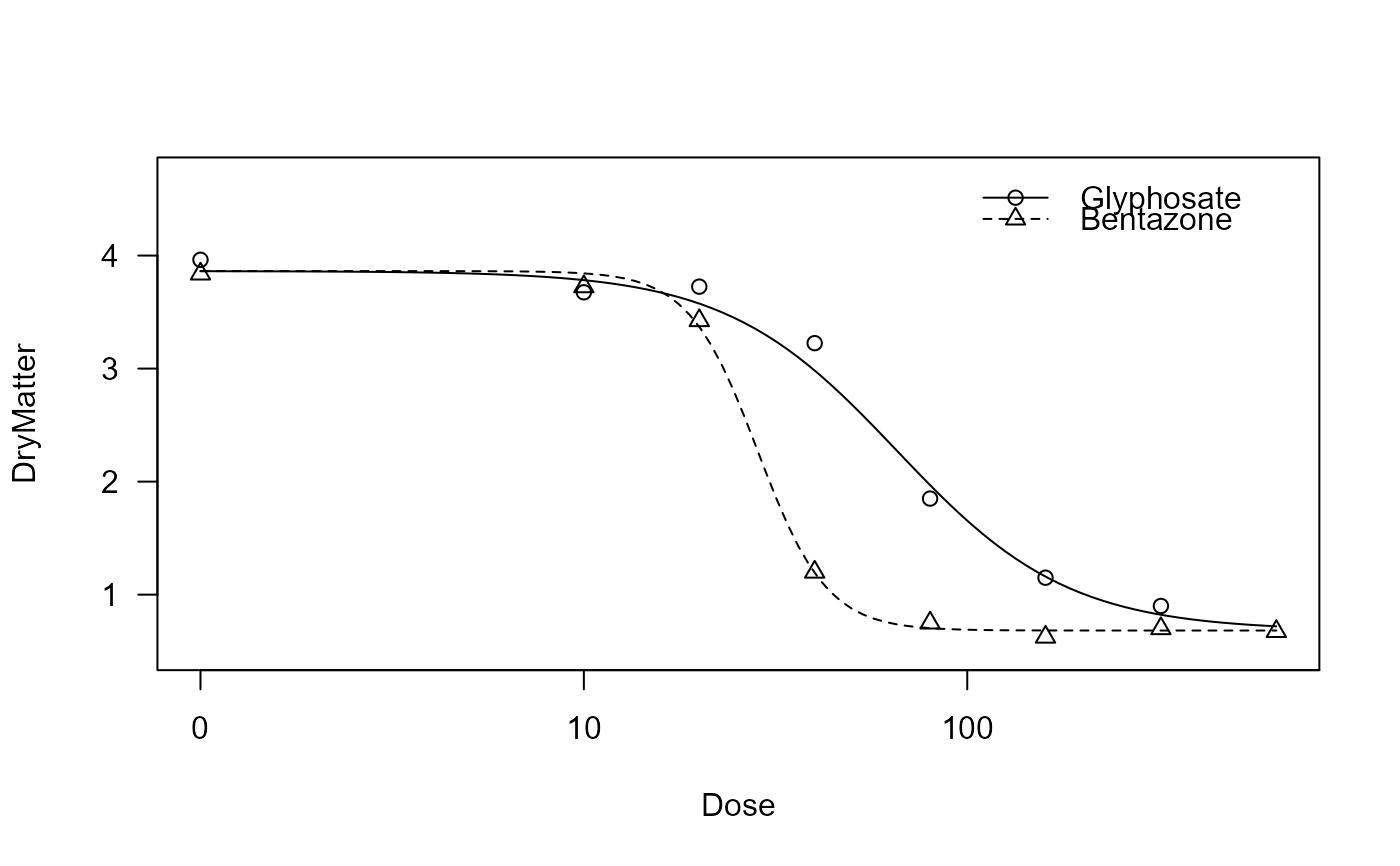
S.alba.RdData are from an experiment, comparing the potency of the two herbicides glyphosate and bentazone in white mustard Sinapis alba.
Usage
data(S.alba)Format
A data frame with 68 observations on the following 3 variables.
Dosea numeric vector containing the dose in g/ha.
Herbicidea factor with levels
BentazoneGlyphosate(the two herbicides applied).DryMattera numeric vector containing the response (dry matter in g/pot).
Details
The lower and upper limits for the two herbicides can be assumed identical, whereas slopes and ED50 values are different (in the log-logistic model).
Source
Christensen, M. G. and Teicher, H. B., and Streibig, J. C. (2003) Linking fluorescence induction curve and biomass in herbicide screening, Pest Management Science, 59, 1303–1310.
Examples
library(drc)
## Fitting a log-logistic model with
## common lower and upper limits
S.alba.LL.4.1 <- drm(DryMatter~Dose, Herbicide, data=S.alba, fct = LL.4(),
pmodels=data.frame(Herbicide,1,1,Herbicide))
summary(S.alba.LL.4.1)
#>
#> Model fitted: Log-logistic (ED50 as parameter) (4 parms)
#>
#> Parameter estimates:
#>
#> Estimate Std. Error t-value p-value
#> b:Bentazone 5.046141 1.040135 4.8514 8.616e-06 ***
#> b:Glyphosate 2.390218 0.495959 4.8194 9.684e-06 ***
#> c:(Intercept) 0.716559 0.089245 8.0291 3.523e-11 ***
#> d:(Intercept) 3.854861 0.076255 50.5519 < 2.2e-16 ***
#> e:Bentazone 28.632355 2.038098 14.0486 < 2.2e-16 ***
#> e:Glyphosate 66.890545 5.968819 11.2067 < 2.2e-16 ***
#> ---
#> Signif. codes: 0 '***' 0.001 '**' 0.01 '*' 0.05 '.' 0.1 ' ' 1
#>
#> Residual standard error:
#>
#> 0.3705151 (62 degrees of freedom)
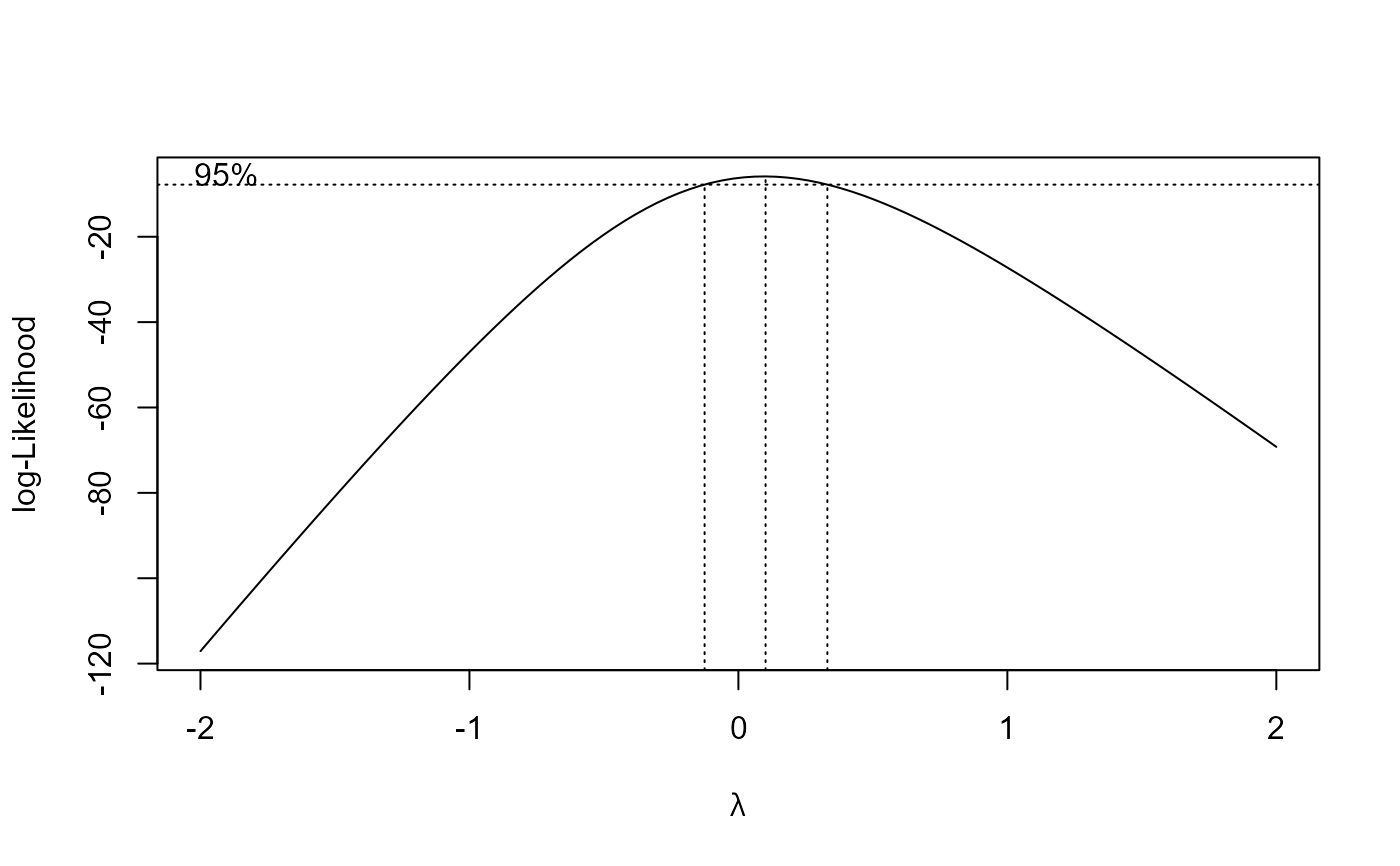
## Applying the optimal transform-both-sides Box-Cox transformation
## (using the initial model fit)
S.alba.LL.4.2 <- boxcox(S.alba.LL.4.1, method = "anova")
 summary(S.alba.LL.4.2)
#>
#> Model fitted: Log-logistic (ED50 as parameter) (4 parms)
#>
#> Parameter estimates:
#>
#> Estimate Std. Error t-value p-value
#> b:Bentazone 4.838636 0.927240 5.2183 2.216e-06 ***
#> b:Glyphosate 1.944311 0.236471 8.2222 1.630e-11 ***
#> c:(Intercept) 0.682591 0.028768 23.7270 < 2.2e-16 ***
#> d:(Intercept) 3.862611 0.106186 36.3760 < 2.2e-16 ***
#> e:Bentazone 28.396147 1.874598 15.1479 < 2.2e-16 ***
#> e:Glyphosate 65.573335 5.618945 11.6700 < 2.2e-16 ***
#> ---
#> Signif. codes: 0 '***' 0.001 '**' 0.01 '*' 0.05 '.' 0.1 ' ' 1
#>
#> Residual standard error:
#>
#> 0.1558947 (62 degrees of freedom)
#>
#> Non-normality/heterogeneity adjustment through Box-Cox transformation
#>
#> Estimated lambda: 0.101
#> Confidence interval for lambda: [-0.126, 0.331]
#>
## Plotting fitted regression curves together with the data
plot(S.alba.LL.4.2)
summary(S.alba.LL.4.2)
#>
#> Model fitted: Log-logistic (ED50 as parameter) (4 parms)
#>
#> Parameter estimates:
#>
#> Estimate Std. Error t-value p-value
#> b:Bentazone 4.838636 0.927240 5.2183 2.216e-06 ***
#> b:Glyphosate 1.944311 0.236471 8.2222 1.630e-11 ***
#> c:(Intercept) 0.682591 0.028768 23.7270 < 2.2e-16 ***
#> d:(Intercept) 3.862611 0.106186 36.3760 < 2.2e-16 ***
#> e:Bentazone 28.396147 1.874598 15.1479 < 2.2e-16 ***
#> e:Glyphosate 65.573335 5.618945 11.6700 < 2.2e-16 ***
#> ---
#> Signif. codes: 0 '***' 0.001 '**' 0.01 '*' 0.05 '.' 0.1 ' ' 1
#>
#> Residual standard error:
#>
#> 0.1558947 (62 degrees of freedom)
#>
#> Non-normality/heterogeneity adjustment through Box-Cox transformation
#>
#> Estimated lambda: 0.101
#> Confidence interval for lambda: [-0.126, 0.331]
#>
## Plotting fitted regression curves together with the data
plot(S.alba.LL.4.2)