Acute inhalation
acute.inh.RdData from an acute inhalation toxicity test. For each of several dose levels, the total number of subjects and the number of dead subjects were recorded.
Usage
data(acute.inh)Format
A data frame with 6 observations on the following 3 variables.
dosea numeric vector
totala numeric vector
num.deada numeric vector
Examples
library(drc)
## Displaying the data
head(acute.inh)
#> dose total num.dead
#> 1 422 5 0
#> 2 744 5 1
#> 3 948 5 3
#> 4 2069 5 5
## Fitting a two-parameter log-logistic model for binomial response
acute.inh.m1 <- drm(num.dead/total ~ dose, weights = total,
data = acute.inh, fct = LL.2(), type = "binomial")
summary(acute.inh.m1)
#>
#> Model fitted: Log-logistic (ED50 as parameter) with lower limit at 0 and upper limit at 1 (2 parms)
#>
#> Parameter estimates:
#>
#> Estimate Std. Error t-value p-value
#> b:(Intercept) -7.9301 5.0812 -1.5607 0.1186
#> e:(Intercept) 895.2982 83.5547 10.7151 <2e-16 ***
#> ---
#> Signif. codes: 0 '***' 0.001 '**' 0.01 '*' 0.05 '.' 0.1 ' ' 1
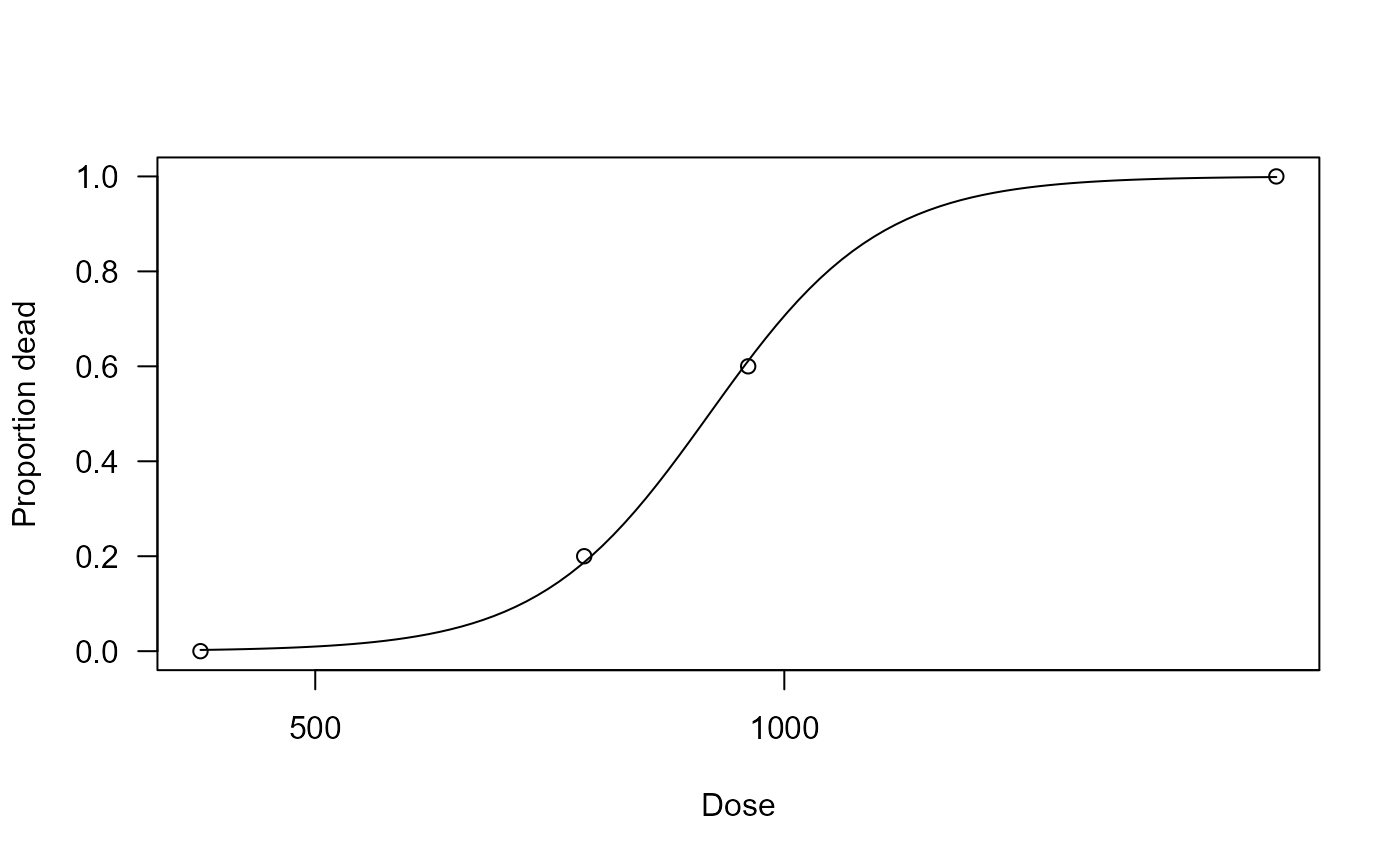
## Plotting the fitted curve
plot(acute.inh.m1, xlab = "Dose", ylab = "Proportion dead")