arbovirus
arbovirus.RdData from a dose-response experiment with an arbovirus involving two treatment groups (FP and SP). For each dose level, the total number of subjects and the numbers of dead and defective subjects were recorded.
Usage
data(arbovirus)Format
A data frame with 9 observations on the following 5 variables.
dosea numeric vector
totala numeric vector
deada numeric vector
defa numeric vector
trta categorical vector
Examples
library(drc)
## Displaying the data
head(arbovirus)
#> dose total dead def trt
#> 1 3 17 3 1 FP
#> 2 18 19 4 1 FP
#> 3 30 19 8 2 FP
#> 4 90 20 17 1 FP
#> 5 3 19 1 0 T
#> 6 20 19 2 0 T
## Fitting a two-parameter log-logistic model for binomial response
arbovirus.m1 <- drm(dead/total ~ dose, trt, weights = total,
data = arbovirus, fct = LL.2(), type = "binomial")
summary(arbovirus.m1)
#>
#> Model fitted: Log-logistic (ED50 as parameter) with lower limit at 0 and upper limit at 1 (2 parms)
#>
#> Parameter estimates:
#>
#> Estimate Std. Error t-value p-value
#> b:FP -1.0219e+00 2.8425e-01 -3.5949 0.0003245 ***
#> b:T -2.8993e-01 7.1182e-02 -4.0731 4.638e-05 ***
#> e:FP 3.2617e+01 8.6014e+00 3.7921 0.0001494 ***
#> e:T 4.1896e+04 3.6484e+04 1.1483 0.2508315
#> ---
#> Signif. codes: 0 '***' 0.001 '**' 0.01 '*' 0.05 '.' 0.1 ' ' 1
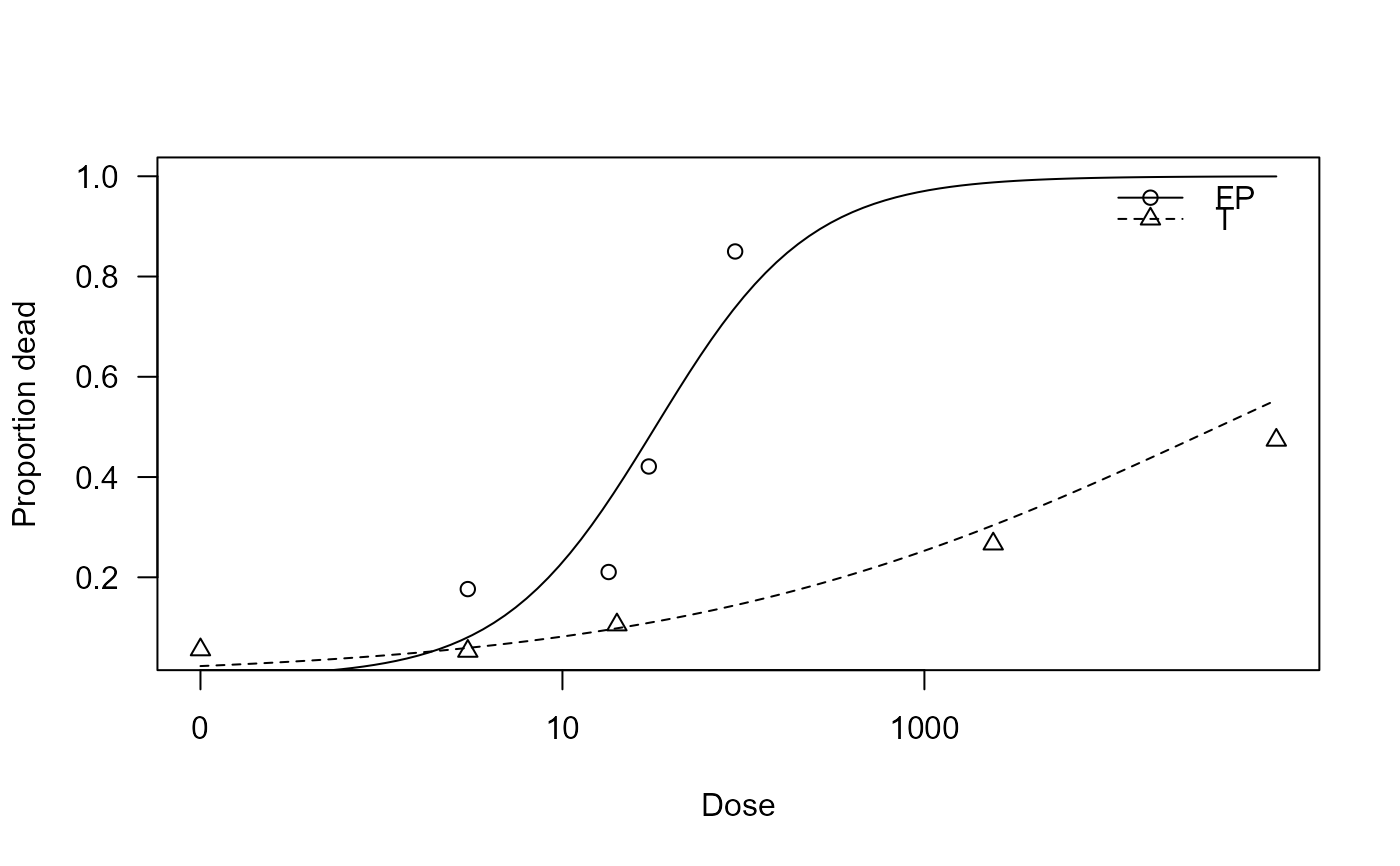
## Plotting the fitted curves
plot(arbovirus.m1, xlab = "Dose", ylab = "Proportion dead")