Barley
barley.RdData from a dose-response experiment measuring the weight of barley (Hordeum vulgare) at different dose levels of a substance.
Usage
data(barley)Format
A data frame with 18 observations of the following 2 variables.
Dosea numeric vector
weighta numeric vector
Examples
library(drc)
## Displaying the data
head(barley)
#> Dose weight
#> 1 0.00000 57.2
#> 2 0.00000 49.8
#> 3 21.09375 62.2
#> 4 21.09375 30.6
#> 5 42.18750 40.9
#> 6 42.18750 70.9
## Fitting a four-parameter log-logistic model
barley.m1 <- drm(weight ~ Dose, data = barley, fct = LL.4())
summary(barley.m1)
#>
#> Model fitted: Log-logistic (ED50 as parameter) (4 parms)
#>
#> Parameter estimates:
#>
#> Estimate Std. Error t-value p-value
#> b:(Intercept) 9.7084 42.9166 0.2262 0.82430
#> c:(Intercept) 11.1275 3.7803 2.9435 0.01068 *
#> d:(Intercept) 52.0478 3.2487 16.0212 2.123e-10 ***
#> e:(Intercept) 286.2600 209.6374 1.3655 0.19364
#> ---
#> Signif. codes: 0 '***' 0.001 '**' 0.01 '*' 0.05 '.' 0.1 ' ' 1
#>
#> Residual standard error:
#>
#> 9.241941 (14 degrees of freedom)
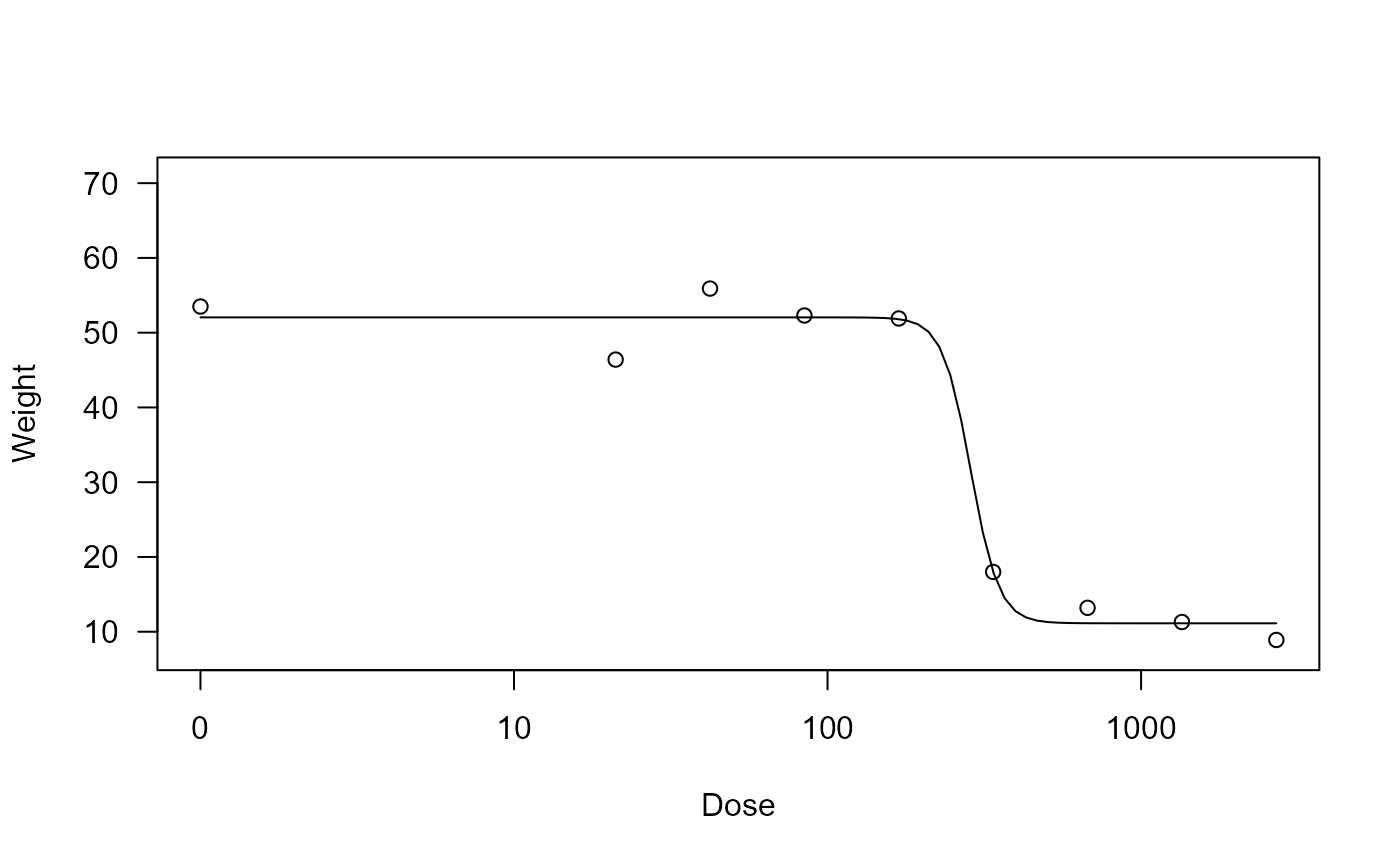
## Plotting the fitted curve
plot(barley.m1, xlab = "Dose", ylab = "Weight")