Damage of lymphocyte cells
carbendazim.RdFor each of 13 dose levels the number of damaged lymphocyte cells were reported. Each dose level consisted of a total of 2000 cells.
Usage
data(carbendazim)Format
A data frame with 13 observations of the following 3 variables.
dosea numeric vector
totala numeric vector
damagea numeric vector
Source
Bentley, K. S. and Kirkland, D. and Murphy, M. and Marshall, R. (2000). Evaluation of thresholds for benomyl- and carbendazim-induced aneuploidy in cultured human lymphocytes using fluorescence in situ hybridization, Mutation Research/Genetic Toxicology and Environmental Mutagenesis, 464, 41–51.
Examples
library(drc)
## Displaying the data
head(carbendazim)
#> dose total damage
#> 1 0 2000 16
#> 2 300 2000 20
#> 3 400 2000 24
#> 4 500 2000 9
#> 5 600 2000 19
#> 6 700 2000 34
## Fitting a two-parameter log-logistic model for binomial response
carbendazim.m1 <- drm(damage/total ~ dose, weights = total,
data = carbendazim, fct = LL.2(), type = "binomial")
summary(carbendazim.m1)
#>
#> Model fitted: Log-logistic (ED50 as parameter) with lower limit at 0 and upper limit at 1 (2 parms)
#>
#> Parameter estimates:
#>
#> Estimate Std. Error t-value p-value
#> b:(Intercept) -1.4379 0.1072 -13.4127 < 2.2e-16 ***
#> e:(Intercept) 10994.2466 1982.6612 5.5452 2.936e-08 ***
#> ---
#> Signif. codes: 0 '***' 0.001 '**' 0.01 '*' 0.05 '.' 0.1 ' ' 1
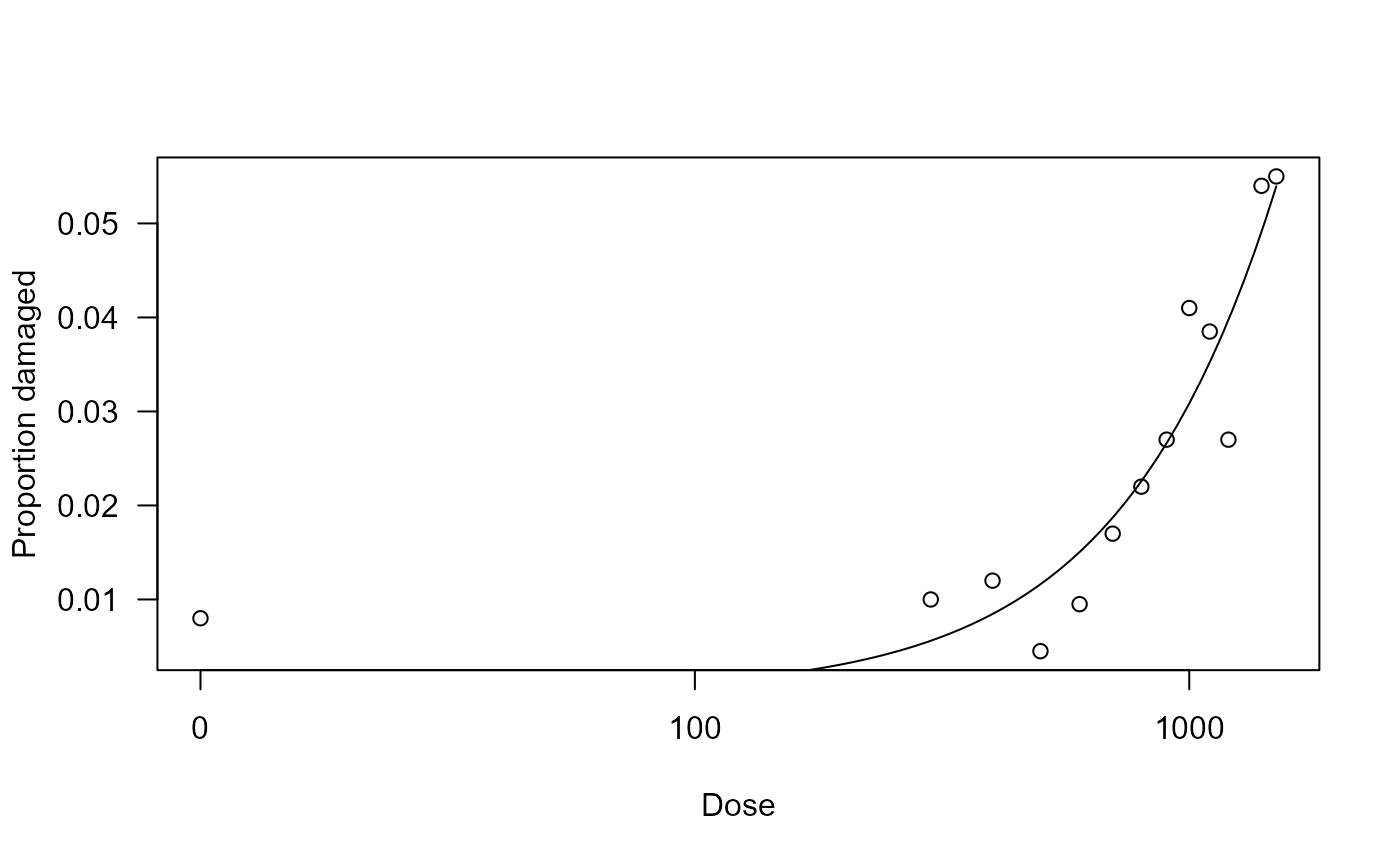
## Plotting the fitted curve
plot(carbendazim.m1, xlab = "Dose", ylab = "Proportion damaged")