chlorac
chlorac.RdData from an acute toxicity test where organisms were exposed to different concentrations of chloroacetaldehyde. The number of dead subjects out of a total were recorded for each concentration.
Usage
data(chlorac)Format
A data frame with 6 observations on the following 3 variables.
conca numeric vector
totala numeric vector
num.deada numeric vector
Examples
library(drc)
## Displaying the data
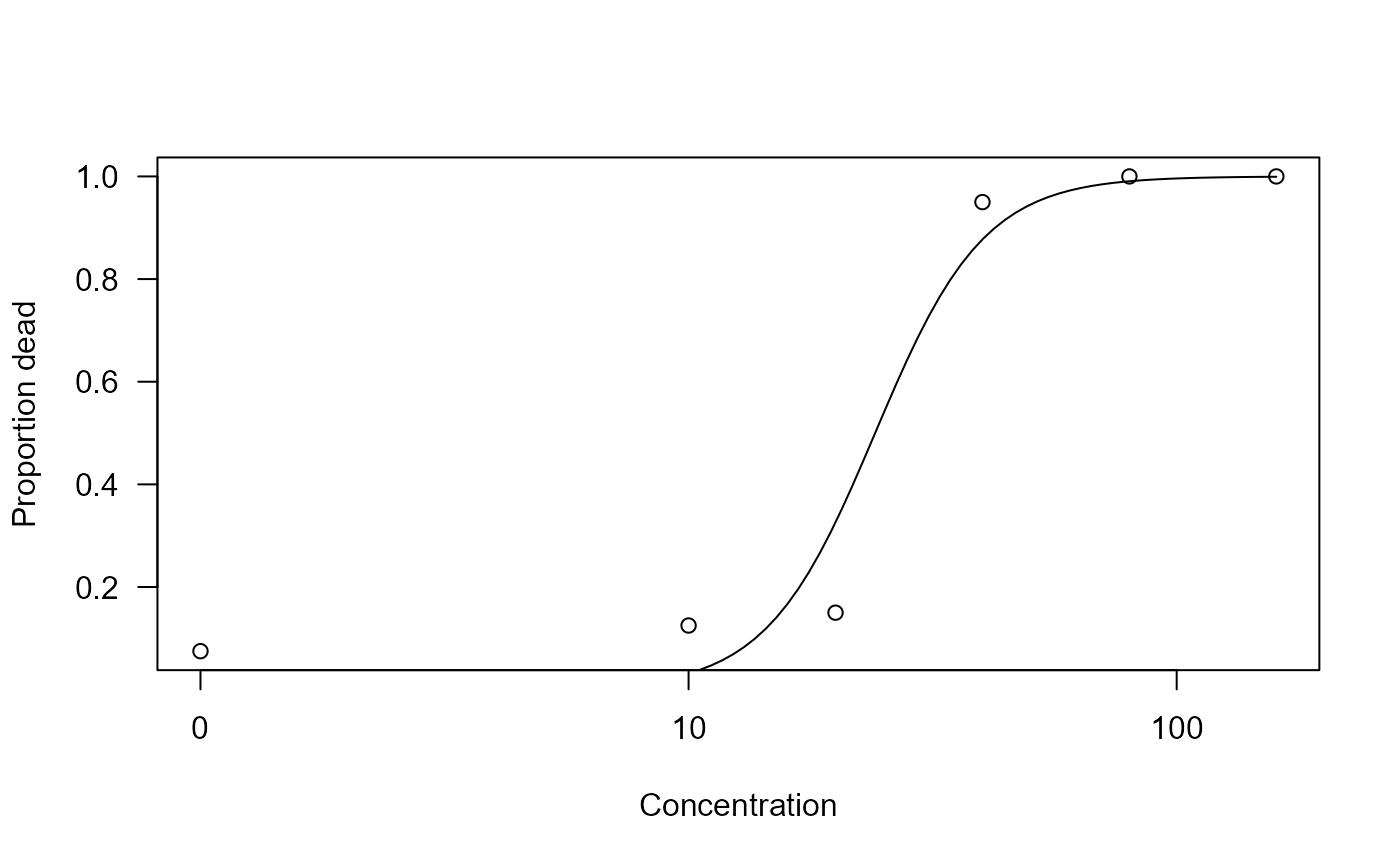
head(chlorac)
#> conc total num.dead
#> 1 0 40 3
#> 2 10 40 5
#> 3 20 40 6
#> 4 40 40 38
#> 5 80 40 40
#> 6 160 40 40
## Fitting a two-parameter log-logistic model for binomial response
chlorac.m1 <- drm(num.dead/total ~ conc, weights = total,
data = chlorac, fct = LL.2(), type = "binomial")
summary(chlorac.m1)
#>
#> Model fitted: Log-logistic (ED50 as parameter) with lower limit at 0 and upper limit at 1 (2 parms)
#>
#> Parameter estimates:
#>
#> Estimate Std. Error t-value p-value
#> b:(Intercept) -3.8861 0.5787 -6.7152 1.878e-11 ***
#> e:(Intercept) 24.1102 1.6173 14.9082 < 2.2e-16 ***
#> ---
#> Signif. codes: 0 '***' 0.001 '**' 0.01 '*' 0.05 '.' 0.1 ' ' 1
## Plotting the fitted curve
plot(chlorac.m1, xlab = "Concentration", ylab = "Proportion dead")