Chlordan
chlordan.RdData from a chronic toxicity test measuring the reproduction of Daphnia exposed to different concentrations of chlordane at two time points. The response measured was the number of offspring (repro) per replicate.
Usage
data(chlordan)Format
A data frame with 60 observations on the following 5 variables.
replicatea numeric vector
conca numeric vector
reproa numeric vector
timea numeric vector
Examples
library(drc)
## Displaying the data
head(chlordan)
#> replicate conc repro time
#> 1 1 0.00 125 21.0
#> 2 1 0.18 89 21.0
#> 3 1 0.73 90 21.0
#> 4 1 1.82 42 21.0
#> 5 1 2.90 29 21.0
#> 6 1 7.00 10 11.5
## Fitting a three-parameter log-logistic model
chlordan.m1 <- drm(repro ~ conc, data = chlordan, fct = LL.3())
summary(chlordan.m1)
#>
#> Model fitted: Log-logistic (ED50 as parameter) with lower limit at 0 (3 parms)
#>
#> Parameter estimates:
#>
#> Estimate Std. Error t-value p-value
#> b:(Intercept) 1.00663 0.14921 6.7463 8.414e-09 ***
#> d:(Intercept) 115.12320 5.05139 22.7904 < 2.2e-16 ***
#> e:(Intercept) 1.55178 0.24368 6.3681 3.565e-08 ***
#> ---
#> Signif. codes: 0 '***' 0.001 '**' 0.01 '*' 0.05 '.' 0.1 ' ' 1
#>
#> Residual standard error:
#>
#> 16.86007 (57 degrees of freedom)
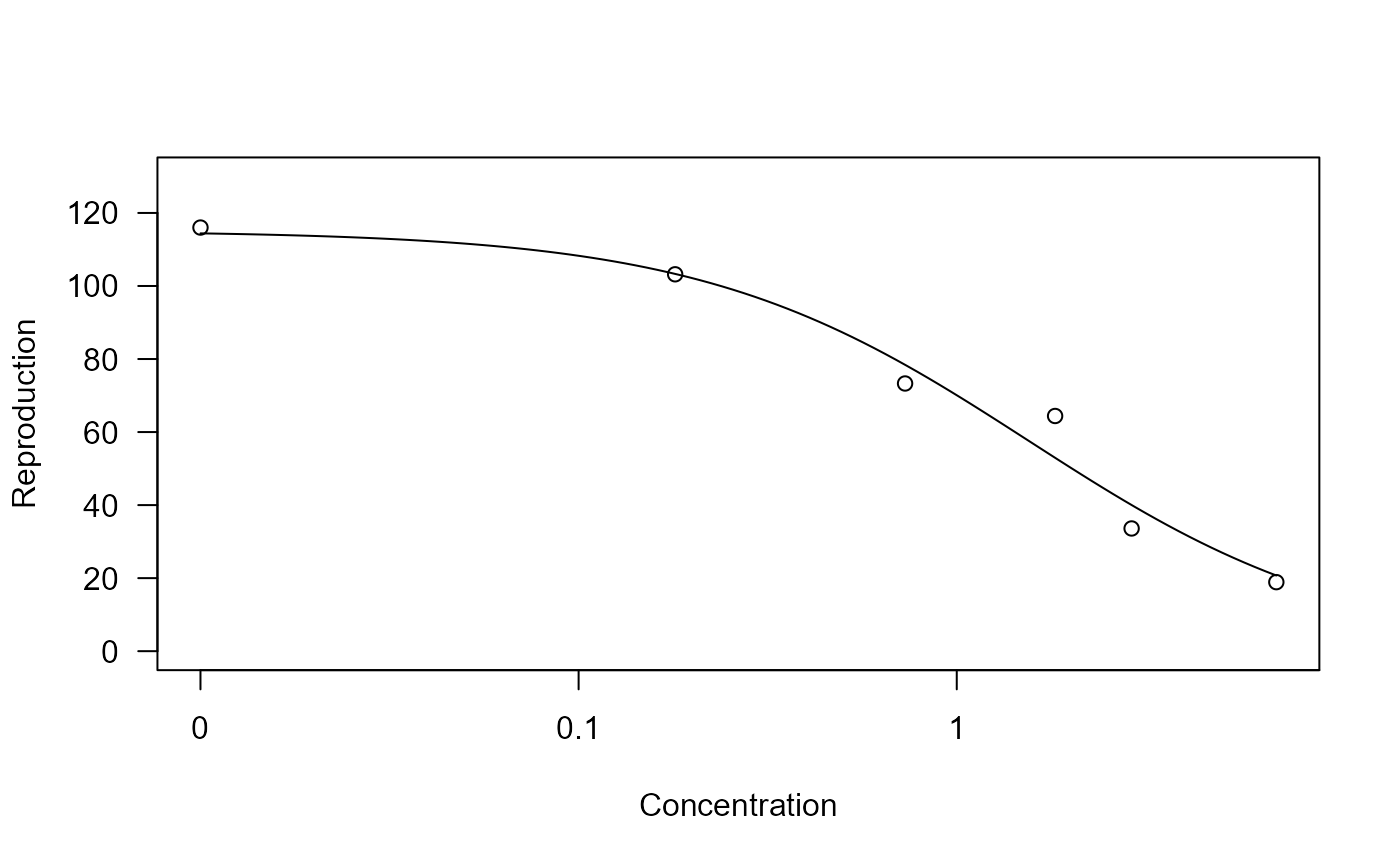
## Plotting the fitted curve
plot(chlordan.m1, xlab = "Concentration", ylab = "Reproduction")