CellTiter-Blue Cell Viability Assay Data
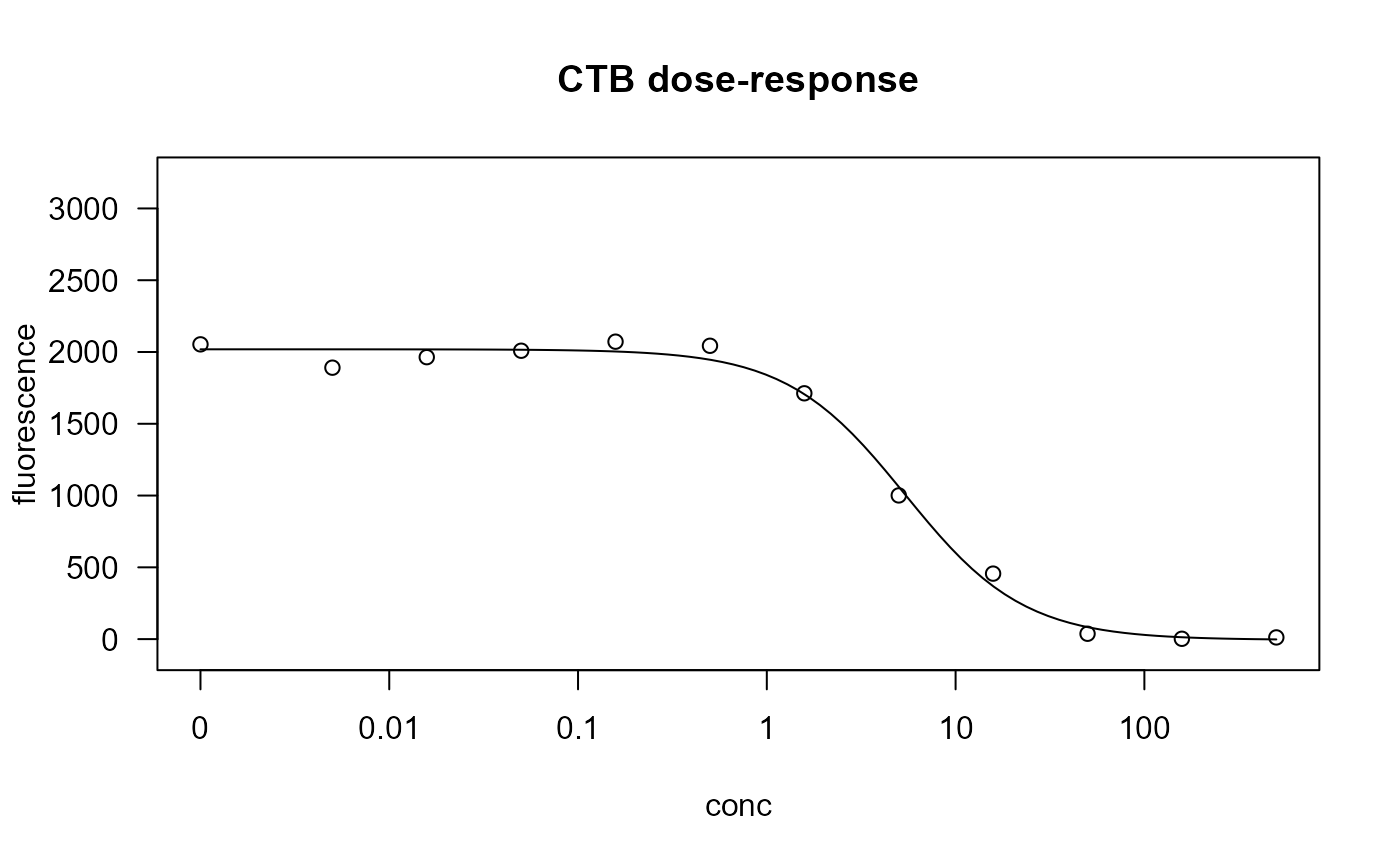
ctb.RdNeurotoxicity test using the CellTiter-Blue Cell Viability Assay on SH-SY5Y cells for increasing concentrations of acrylamide.
Usage
data(ctb)Format
A data frame with 647 observations on the following 5 variables.
wellwell ID of a 96 well plate
conc12 concentrations of acrylamide, ranging from 0-500mM
fluorescencemeasured fluorescence after adding the resazurin reagent into the wells
dayinteger denoting 3 different days
platefactor with 7 levels representing the plate ID
References
Frimat, JP, Sisnaiske, J, Subbiah, S, Menne, H, Godoy, P, Lampen, P, Leist, M, Franzke, J, Hengstler, JG, van Thriel, C, West, J. The network formation assay: a spatially standardized neurite outgrowth analytical display for neurotoxicity screening. Lab Chip 2010; 10:701-709.
Examples
data(ctb)
ctb$day <- as.factor(ctb$day)

## Fit a four-parameter log-logistic model
ctb.m1 <- drm(fluorescence ~ conc, data = ctb, fct = LL.4())
summary(ctb.m1)
#>
#> Model fitted: Log-logistic (ED50 as parameter) (4 parms)
#>
#> Parameter estimates:
#>
#>                 Estimate Std. Error t-value   p-value
#> b:(Intercept)    1.38280    0.18094  7.6423 7.777e-14 ***
#> c:(Intercept)   -5.87847   62.69971 -0.0938    0.9253
#> d:(Intercept) 2018.73268   36.19882 55.7679 < 2.2e-16 ***
#> e:(Intercept)    5.40830    0.65619  8.2420 9.203e-16 ***
#> ---
#> Signif. codes:  0 '***' 0.001 '**' 0.01 '*' 0.05 '.' 0.1 ' ' 1
#>
#> Residual standard error:
#>
#>  625.4192 (643 degrees of freedom)
plot(ctb.m1, main = "CTB dose-response")