Infections as response to exposure with Echovirus 12
echovirus.RdFor each of four doses of a pathogen, Echovirus 12, the number of exposed and infected human volunteers are reported.
Usage
data(echovirus)Format
A data frame with 4 observations on the following 3 variables.
dosea numeric vector reporting the dose in plague forming units (pfu)
totala numeric vector
infecteda numeric vector
Source
H. Moon, S. B. Kim, J. J. Chen, N. I. George, and R. L. Kodell (2013). Model uncertainty and model averaging in the estimation of infectious doses for microbial pathogens. Risk Analysis, 33(2):220-231.
Examples
library(drc)
## Displaying the data
head(echovirus)
#> dose total infected
#> 1 330 50 15
#> 2 1000 20 9
#> 3 3300 26 19
#> 4 10000 12 12
## Fitting a two-parameter log-logistic model for binomial response
echovirus.m1 <- drm(infected/total ~ dose, weights = total,
data = echovirus, fct = LL.2(), type = "binomial")
summary(echovirus.m1)
#>
#> Model fitted: Log-logistic (ED50 as parameter) with lower limit at 0 and upper limit at 1 (2 parms)
#>
#> Parameter estimates:
#>
#> Estimate Std. Error t-value p-value
#> b:(Intercept) -0.94621 0.20507 -4.6141 3.948e-06 ***
#> e:(Intercept) 921.04805 215.00279 4.2839 1.837e-05 ***
#> ---
#> Signif. codes: 0 '***' 0.001 '**' 0.01 '*' 0.05 '.' 0.1 ' ' 1
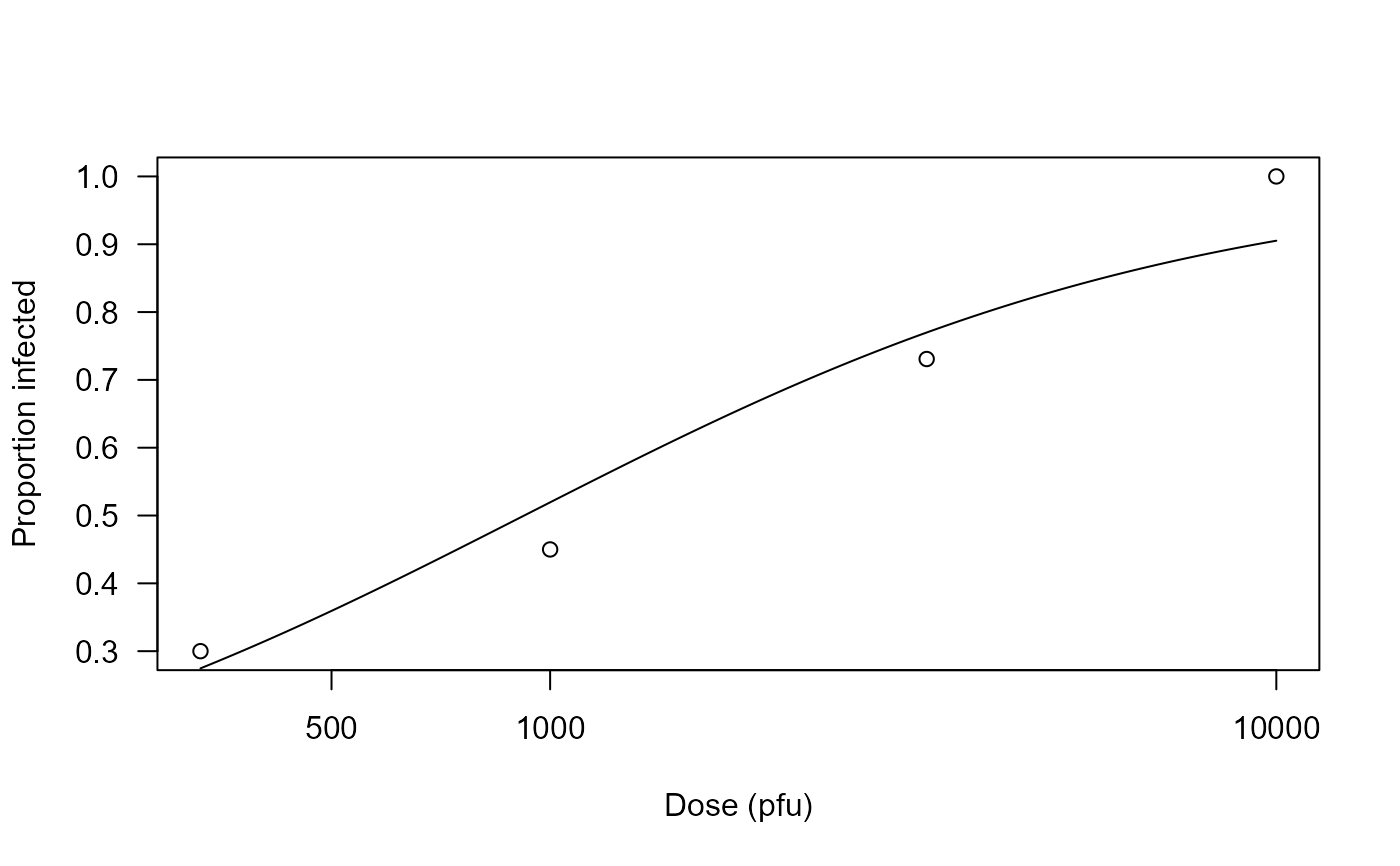
## Plotting the fitted curve
plot(echovirus.m1, xlab = "Dose (pfu)", ylab = "Proportion infected")