guthion
guthion.RdData from an acute toxicity test with the insecticide guthion (azinphos-methyl). For each dose level in two treatment groups, the numbers of alive, moribund, and dead subjects were recorded.
Usage
data(guthion)Format
A data frame with 6 observations on the following 6 variables.
trta categorial vector
dosea numeric vector
alivea numeric vector
moribunda numeric vector
deada numeric vector
totala numeric vector
Examples
library(drc)
## Displaying the data
head(guthion)
#> trt dose alive moribund dead total
#> 1 S 20.0 44 1 5 50
#> 2 S 35.0 28 1 21 50
#> 3 S 45.0 8 7 35 50
#> 4 T 1.0 37 1 12 50
#> 5 T 1.5 20 2 28 50
#> 6 T 2.0 8 6 36 50
## Fitting a two-parameter log-logistic model for binomial response
guthion.m1 <- drm(dead/total ~ dose, trt, weights = total,
data = guthion, fct = LL.2(), type = "binomial")
summary(guthion.m1)
#>
#> Model fitted: Log-logistic (ED50 as parameter) with lower limit at 0 and upper limit at 1 (2 parms)
#>
#> Parameter estimates:
#>
#> Estimate Std. Error t-value p-value
#> b:S -3.768548 0.712361 -5.2902 1.222e-07 ***
#> b:T -3.051117 0.656853 -4.6451 3.400e-06 ***
#> e:S 36.891558 1.887823 19.5418 < 2.2e-16 ***
#> e:T 1.432554 0.083677 17.1201 < 2.2e-16 ***
#> ---
#> Signif. codes: 0 '***' 0.001 '**' 0.01 '*' 0.05 '.' 0.1 ' ' 1
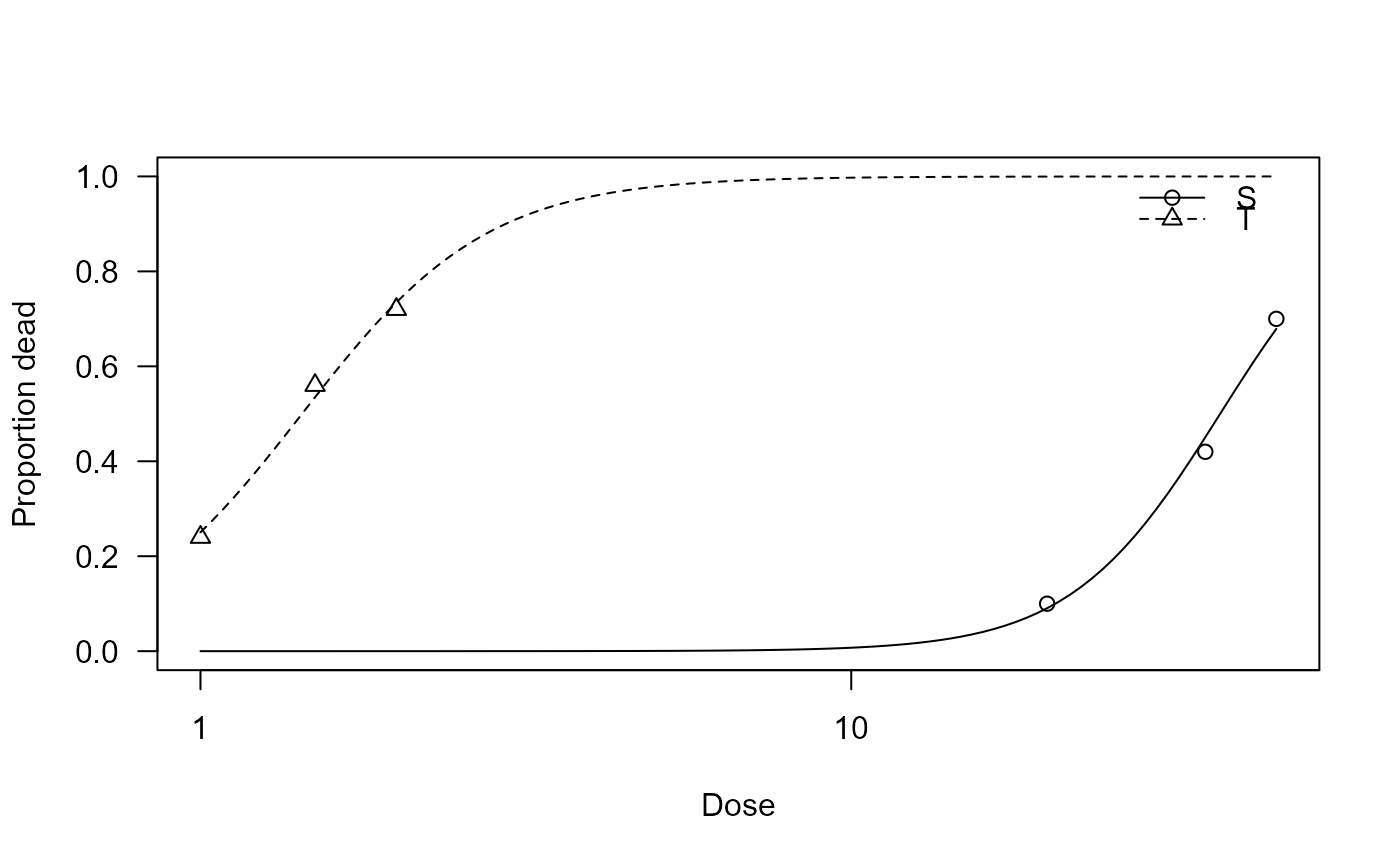
## Plotting the fitted curves
plot(guthion.m1, xlab = "Dose", ylab = "Proportion dead", ylim = c(0, 1))