Lemna
lemna.RdData from a dose-response experiment with the aquatic plant Lemna minor (duckweed). The response measured was the frond number (count) at different concentrations of a test substance.
Usage
data(lemna)Format
A data frame with 44 observations on the following 2 variables.
conca numeric vector containing the concentration.
frond.numa numeric vector containing the response (count).
Examples
library(drc)
## Displaying the data
head(lemna)
#> conc frond.num
#> 1 0 70
#> 2 0 66
#> 3 0 61
#> 4 0 65
#> 5 0 65
#> 6 0 61
## Fitting a four-parameter log-logistic model
lemna.m1 <- drm(frond.num ~ conc, data = lemna, fct = LL.4())
summary(lemna.m1)
#>
#> Model fitted: Log-logistic (ED50 as parameter) (4 parms)
#>
#> Parameter estimates:
#>
#> Estimate Std. Error t-value p-value
#> b:(Intercept) 0.80378 0.13342 6.0246 4.364e-07 ***
#> c:(Intercept) 25.12544 4.10027 6.1278 3.125e-07 ***
#> d:(Intercept) 65.67420 1.09101 60.1957 < 2.2e-16 ***
#> e:(Intercept) 10.05380 3.20991 3.1321 0.003241 **
#> ---
#> Signif. codes: 0 '***' 0.001 '**' 0.01 '*' 0.05 '.' 0.1 ' ' 1
#>
#> Residual standard error:
#>
#> 3.240232 (40 degrees of freedom)
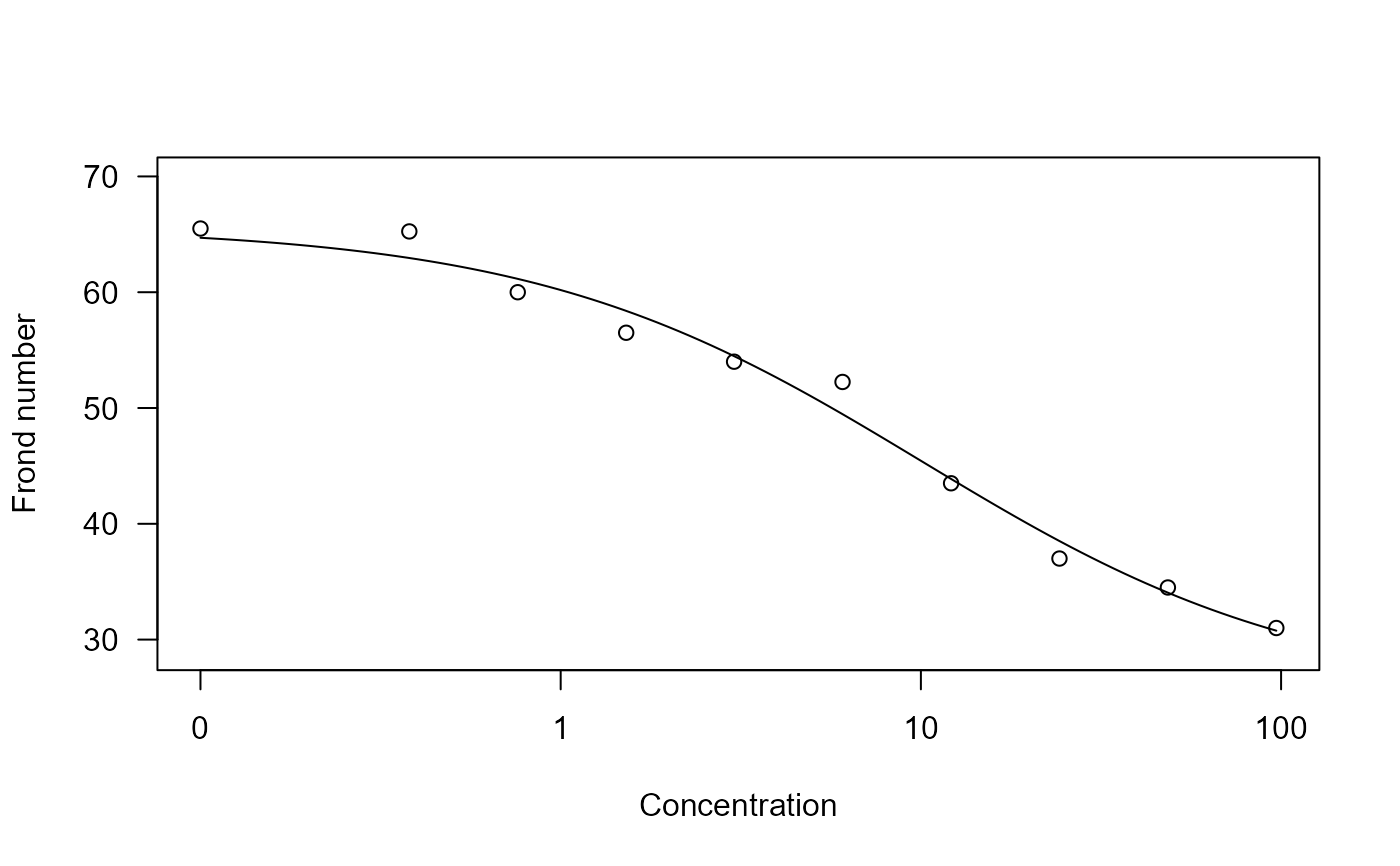
## Plotting the fitted curve
plot(lemna.m1, xlab = "Concentration", ylab = "Frond number")