Lack-of-fit test for the mean structure based on cumulated residuals
Source:R/lin.test.R
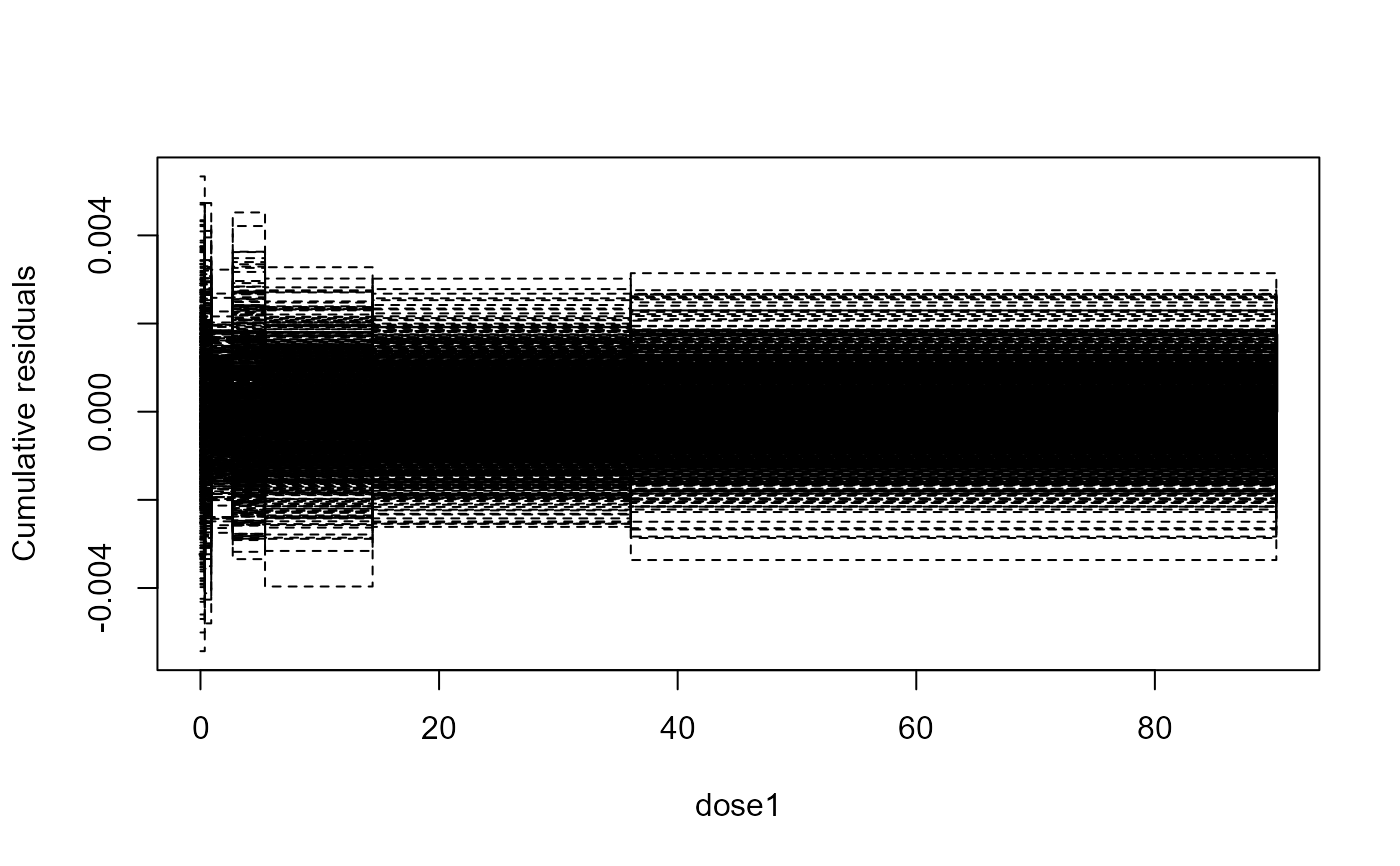
lin.test.RdThe function provides a lack-of-fit test for the mean structure based on cumulated residuals from the model fit.
Usage
lin.test(
  object,
  noksSim = 20,
  seed = 20070325,
  plotit = TRUE,
  log = "",
  bp = 0.01,
  xlab,
  ylab,
  ylim,
  ...
)
Arguments
- object
object of class 'drc'.
- noksSim
numeric specifying the number of simulations used to obtain the p-value.
- seed
numeric specifying the seed value for the random number generator.
- plotit
logical indicating whether or not the observed cumulated residual process should be plotted. Default is to plot the process.
- log
character string which should contain
"x"if the x axis is to be logarithmic,"y"if the y axis is to be logarithmic and"xy"or"yx"if both axes are to be logarithmic. The empty string""yields the original axes.- bp
numeric value specifying the break point below which the dose is zero.
- xlab
character string specifying an optional label for the x axis.
- ylab
character string specifying an optional label for the y axis.
- ylim
numeric vector of length two, containing the lower and upper limit for the y axis.
- ...
additional arguments to be passed further to the basic
plotmethod.
Value
A p-value for test of the null hypothesis that the mean structure is appropriate. Ritz and Martinussen (2009) provide the details.
Details
The function provides a graphical model checking of the mean structure in a dose-response model. The graphical display is supplemented by a p-value based on a supremum-type test.
The test is applicable even in cases where data are non-normal or exhibit variance heterogeneity.
References
Ritz, C and Martinussen, T. (2009) Lack-of-fit tests for assessing mean structures for continuous dose-response data, Submitted manuscript
See also
Other available lack-of-fit tests are the Neill test (neill.test)
and ANOVA-based test (modelFit).