Weight gain for different methionine sources
methionine.RdData consist of average body weight gain of chickens being treated with one of the two methionine sources DLM and HMTBA.
Usage
data(methionine)Format
A data frame with 9 observations on the following 3 variables:
producta factor with levels
control,DLMandMHAdenoting the treatmentsdosea numeric vector of methionine dose
gaina numeric vector of average body weight gain
Source
Kratzer. D. D. and Littell, R. C. (2006) Appropriate Statistical Methods to Compare Dose Responses of Methionine Sources, Poultry Science, 85, 947–954.
Examples
library(drc)
## Fitting model with constraint on one parameter
met.ar.m1 <- drm(gain~dose, product, data = methionine,
fct = AR.3(), pmodels = list(~1, ~factor(product), ~factor(product)),
upperl = c(Inf, Inf, 1700, Inf, Inf))
#> Control measurements detected for level: control
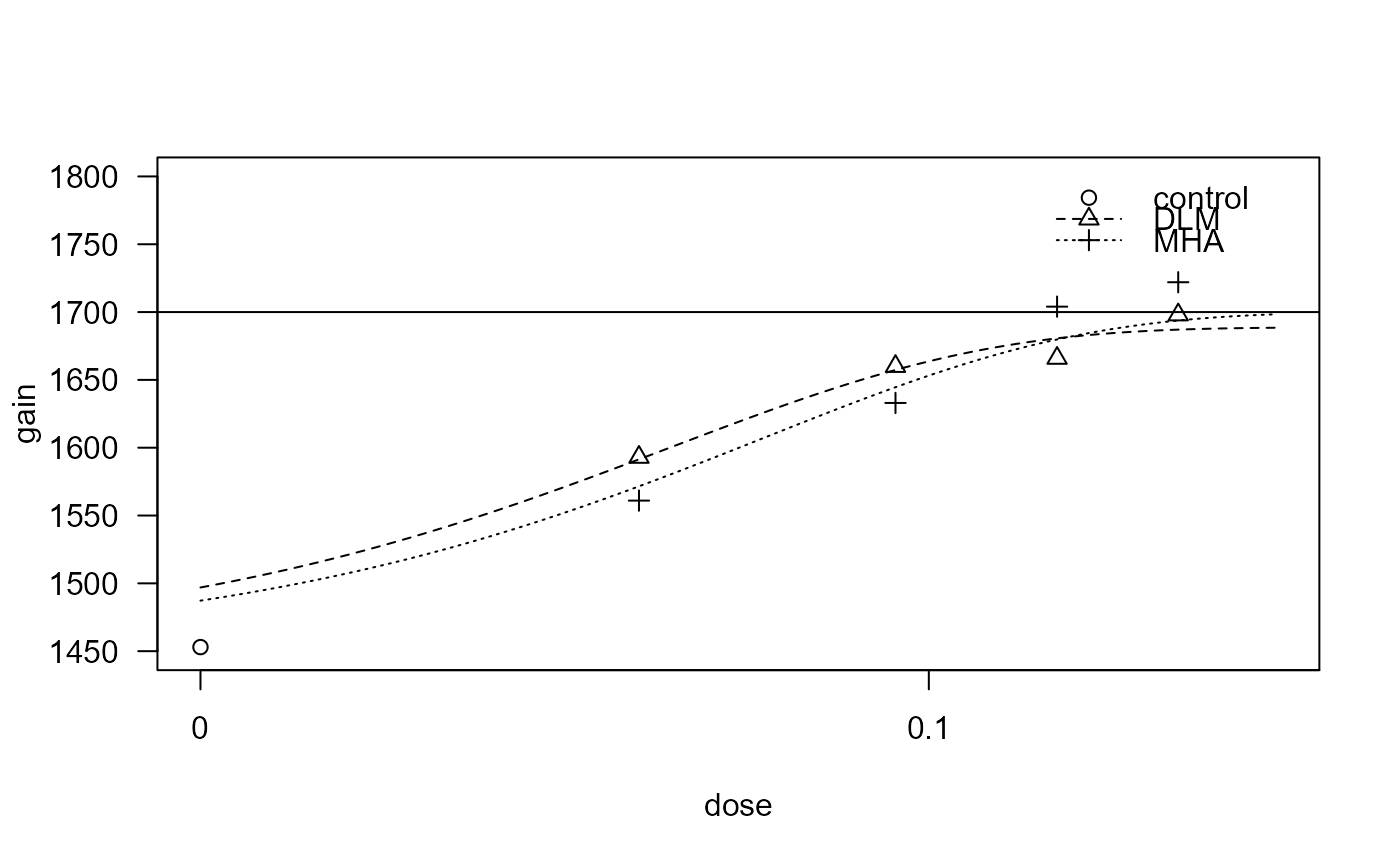
plot(met.ar.m1, xlim=c(0,0.3), ylim=c(1450, 1800))
abline(h=1700, lty=1)
 summary(met.ar.m1)
#>
#> Model fitted: Shifted asymptotic regression (3 parms)
#>
#> Parameter estimates:
#>
#> Estimate Std. Error t-value p-value
#> c:(Intercept) 1.4483e+03 2.1249e+01 68.1582 2.776e-07 ***
#> d:DLM 1.6887e+03 1.9221e+01 87.8589 1.006e-07 ***
#> d:MHA 1.7000e+03 2.0773e+01 81.8359 1.336e-07 ***
#> e:DLM 4.4217e-02 1.4050e-02 3.1472 0.03461 *
#> e:MHA 5.9462e-02 1.4529e-02 4.0925 0.01494 *
#> ---
#> Signif. codes: 0 '***' 0.001 '**' 0.01 '*' 0.05 '.' 0.1 ' ' 1
#>
#> Residual standard error:
#>
#> 22.32469 (4 degrees of freedom)
summary(met.ar.m1)
#>
#> Model fitted: Shifted asymptotic regression (3 parms)
#>
#> Parameter estimates:
#>
#> Estimate Std. Error t-value p-value
#> c:(Intercept) 1.4483e+03 2.1249e+01 68.1582 2.776e-07 ***
#> d:DLM 1.6887e+03 1.9221e+01 87.8589 1.006e-07 ***
#> d:MHA 1.7000e+03 2.0773e+01 81.8359 1.336e-07 ***
#> e:DLM 4.4217e-02 1.4050e-02 3.1472 0.03461 *
#> e:MHA 5.9462e-02 1.4529e-02 4.0925 0.01494 *
#> ---
#> Signif. codes: 0 '***' 0.001 '**' 0.01 '*' 0.05 '.' 0.1 ' ' 1
#>
#> Residual standard error:
#>
#> 22.32469 (4 degrees of freedom)