Inhibition of photosynthesis
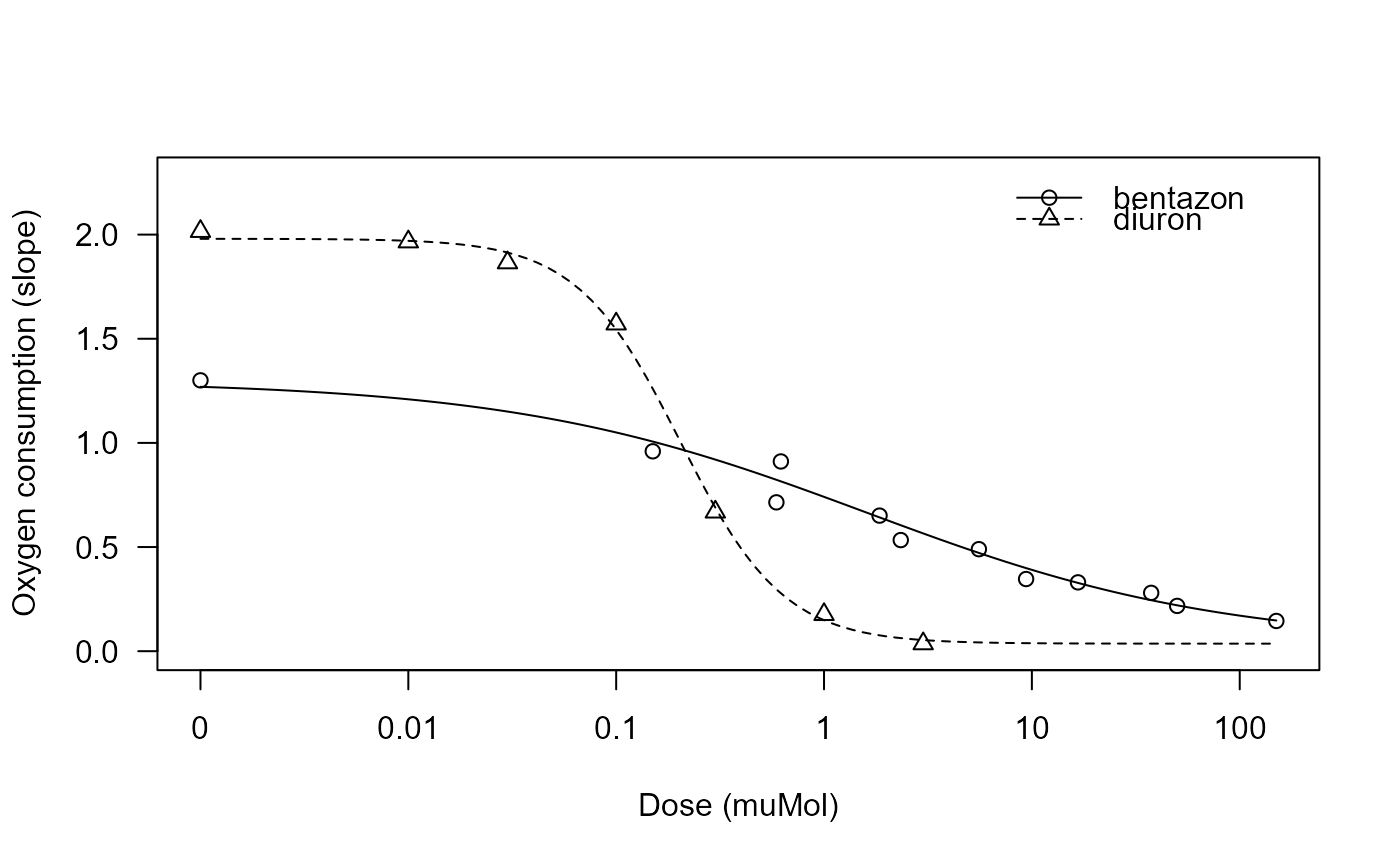
spinach.RdData from an experiment investigating the inhibition of photosynthesis in response to two synthetic photosystem II inhibitors, the herbicides diuron and bentazon. More specifically, the effect of oxygen consumption of thylakoid membranes (chloroplasts) from spinach was measured after incubation with the synthetic inhibitors in 5 assays, resulting in 5 dose-response curves.
Usage
data(spinach)Format
A data frame with 105 observations on the following four variables:
- CURVE
a numeric vector specifying the assay or curve (a total of 5 independent assays where used in this experiment).
- HERBICIDE
a character vector specifying the herbicide applied: bentazon or diuron.
- DOSE
a numeric vector giving the herbicide concentration in muMol.
- SLOPE
a numeric vector with the measured response: oxygen consumption of thylakoid membranes.
Source
Streibig, J. C. (1998) Joint action of natural and synthetic photosystem II inhibitors, Pesticide Science, 55, 137–146.
Examples
library(drc)

## Displaying the first rows in the dataset
head(spinach)
#>   CURVE HERBICIDE DOSE   SLOPE
#> 1     1  bentazon 0.00 1.81295
#> 2     1  bentazon 0.00 1.86704
#> 3     1  bentazon 0.00 1.95606
#> 4     1  bentazon 0.62 1.39073
#> 5     1  bentazon 0.62 1.15721
#> 6     1  bentazon 0.62 1.06126

## Fitting a four-parameter log-logistic model with separate curves per herbicide
spinach.m1 <- drm(SLOPE ~ DOSE, HERBICIDE, data = spinach, fct = LL.4())
summary(spinach.m1)
#>
#> Model fitted: Log-logistic (ED50 as parameter) (4 parms)
#>
#> Parameter estimates:
#>
#>            Estimate Std. Error t-value   p-value
#> b:bentazon 0.508817   0.161880  3.1432  0.002218 **
#> b:diuron   1.750572   0.334200  5.2381 9.433e-07 ***
#> c:bentazon 0.033202   0.159736  0.2079  0.835779
#> c:diuron   0.036149   0.080884  0.4469  0.655925
#> d:bentazon 1.298217   0.067350 19.2757 < 2.2e-16 ***
#> d:diuron   1.979936   0.055804 35.4799 < 2.2e-16 ***
#> e:bentazon 1.599804   1.000457  1.5991  0.113057
#> e:diuron   0.203161   0.022802  8.9098 3.022e-14 ***
#> ---
#> Signif. codes:  0 '***' 0.001 '**' 0.01 '*' 0.05 '.' 0.1 ' ' 1
#>
#> Residual standard error:
#>
#>  0.2022188 (97 degrees of freedom)

## Plotting the fitted curves
plot(spinach.m1, xlab = "Dose (muMol)", ylab = "Oxygen consumption (slope)")